Terms - Alphabetical Index
Note: All security figures are calculated with the cost-model.
Anzahl der Geschäfte eines Handelstages.
Best ask size
If bid/ask shows a zero value and if bid/ask size shows a tradable volume the order book contains a market order. There are the following basic types of orders:
Market Order: Market orders are unlimited buy or sell orders to be executed at the next price that is determined.
Limit Orders: Limit orders are buy or sell orders to be executed at the set limit price or better.
Auction with liquidity providers
The core function of a liquidity provider in securities trading is to create liquidity by bridging temporary imbalances between supply and demand. The liquidity provider enters firm buy and sell prices into the trading system, increasing the probability of orders being executed and thus raising liquidity.
The orderbook is fully open during the auction for securities with liquidity providers. Limits and aggregate order volumes per limit are displayed to all trading participants and investors.
Average traded price for a security during a trading day.
Average traded volume for a security during a trading day.
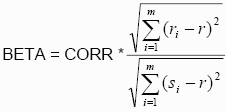
The measure of a stock's risk in relation to the market (represented by an index). A beta of 1 means that a stock's volatility is expected to move conformable to the market. A beta of e.g. 1.2 means that the stock’s volatility is 20 % higher than those of the market.
The calculation of the beta-factor is based on the closing prices of the last 3 months:

with Si = closing prices of the share, Bi = closing prices of a benchmark instrument for i=1,…,m

Price a prospective buyer is willing to pay.
Indicates if the order type of Bid/Ask is a market order or a limit order.
0: Market Order, 1: Limit Order
Best bid size.
If bid/ask shows a zero value and if bid/ask size shows a tradable volume the order book contains a market order. There are the following basic types of orders:
Market Order: Market orders are unlimited buy or sell orders to be executed at the next price that is determined.
Limit Orders: Limit orders are buy or sell orders to be executed at the set limit price or better.
The book value per share describes the balance value of the part of the company that belongs to the investor in the form of a share and corresponds to the total equity divided by the amount of shares issued.
The cash flow per share shows the result of cash flow divided by number of issued shares.
Percentage change / absolute change of last trade price to the last trade price of the previous trading day resp. the previous last trade price generally.
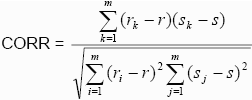
Correlation measures the interdependence of two variables, for example among a stock and an index. The correlation coefficient is scaled from -1 (contrary trend) to +1 (synchronous trend). A correlation coefficient of 0 indicates that there is no context of the price performances.
The calculation of the correlation is based on the closing prices of the last 3 months:

with Si = closing prices of the share, Bi = closing prices of a benchmark instrument for i=1,…,m

Denomination currency of a share.
Date and time of last traded price.
The share of a joint stock company's accumulated profits that is distributed among the shareholders per share. It is expressed either in percentage of the par value or in currency units per share.
In the details field the dividend paid to shareholders is shown for the preceding financial year (e.g. in year 2007 the dividend paid for the financial year 2006 is stated).
An abnormal dividend declared out of profits.
Key ratio for profitability of a security, which represents the net profit per share of the last 12 months in percent of the stock price. This figure corresponds to the reciprocal of the price/earnings ratio.
A company's profit divided by the weighted average of shares outstanding. EPS is an important figure in order to rate the profitability of a company and indicates the part of total earnings for one share.
Growth of Earnings per share, expressed in percent.
Total assets divided by shareholder equity. The higher the equity ratio, the lower the rate of debts, though this can indicate a desiderative readiness to invest and grow.
It is recommended to analyze the equity ratio both on historical basis as well as on sector's average.
Last daily high of listing.
Last historic close of listing.
The auction price that would have been determined if the auction were to close at this point in time.
(International Securities Identification Number) Individual Securities Identification Number, prodived for electronic registration of securities on an international basis.
Last trade price.
Number of traded securities of the last trade.
Last daily low of listing.
The market value of an entire company, calculated by multiplying the number of shares outstanding by the price per share.
Number of trades of a trading day.
(engl.: Price-Earnings-Ratio, PER)
Last open of listing.
The key figure Price-Earning to Growth-Ratio relates a business year's KGV to the forecasted increase in profit. A PEG-Ratio below 1 indicates an underevaluation, above 1 an overevaluation and PEG of 1 a fair evaluation of a company. To make sense, a company's PEG should be compared to the sector's average.
Price to cash flow ratio is calculated as follows: A stock's price divided by the cash flow of the share. The price to cash flow ratio declares the development of profitability of a company and allows to compare different companies.
The performance of a security compared against an index.
Positive values of relative Performance of a share indicate, that the performance of the share was better than this of the index within the referred time frame.
Amount of shares included for trading.
The price which determines the price for physical delivery of trades. In case of derivatives trading the underlying instrument or the price at which contracts are cash settled on the last trading day.
possible content: B/S/N
B: surplus in auction is on Buy-side (demand exceeds supply).
S: surplus in auction is on Sell-side (supply exceeds demand).
N: No surplus in auction.
A surplus of orders is given if demand in a listing exceeds supply at the end of the call phase in an auction, or if supply exceeds demand at the end of the call phase in an auction. Market participants have the possibility to execute orders from the remaining surplus of an auction (i.e., orders with an auction price limit or a better limit that were left unfilled) at the auction price.
For listings traded with closed orderbook in an auction information concerning potential surplus in auction is available during the entire call phase. For all instruments traded with open orderbook the surplus in auction is displayed only during the Price determination phase.
The Call phase is the opening phase of an auction that is followed by the price determination phase or, if applicable, the order book balancing phase. During this phase, market participants may enter new orders.
Continuous trading
Trading form in which securities prices are determined continuously during the trading session.
Auction
A trading procedure on an exchange in which liquidity is concentrated by bundling and taking into account all orders placed. Buy and sell orders are listed opposite to each other in an orderbook and the auction price is determined by applying the principle of matching as many orders as possible.
Time frame during which a security is tradeable on a trading day.
Turnover value of the trading day in double count.
Sum of all traded securities of the last trading day.
Measure for the average price range of a stock for a certain period of time. The higher the volatility of a security is, the chancier it can be understood. Statistically seen volatility corresponds to standard deviation.
The calculation of the historical volatility is based on the closing prices (Si, for i=1,...,n) of the last 3 months:

The annualised historical volatility is then given by:
![]()
with 256 being the exemplary number of trading days per year.
Volume-weighted average price. VWAP represents the total value of stocks traded in a particular security for a given time period, divided by the total volume of stocks traded in that security during that same time period.
VWAP = Turnover volume / Turnover value
Highest price in the last 52 weeks. This price can be adjusted due to corporate actions.
The calculation of is based on intraday trades.
Lowest price in the last 52 weeks. This price can be adjusted due to corporate actions.
The calculation of is based on intraday trades.
