
If the resistance lines are breached, this is a buy or sell signal.
Basic principles
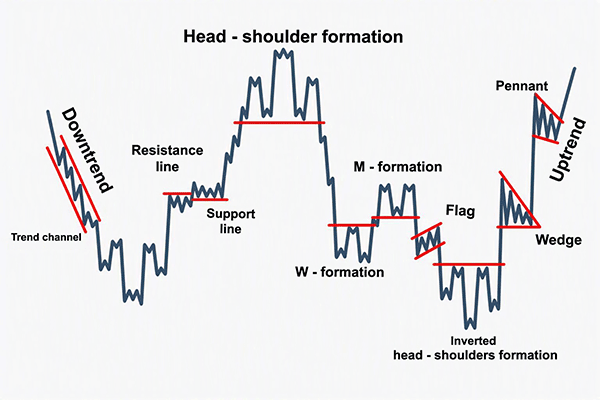
Among the most important basic principles of technical analysis are support and resistance lines, as well as trend channels.
- Support line
A support line is a price level that has been reached several times within a specific period but has not been broken to the downside. If it is eventually broken, it is considered a sell signal. - Resistance line
A resistance line is a price level that has been reached several times within a specific period but has not been broken to the upside. If it is eventually broken, it is considered a buy signal. - Trend channel
A trend channel is a price trend that develops within a specific range.- Uptrend
Each low of the price is above the previous low, each high above the previous high. This is considered a buy signal. - Downtrend
Each low of a price is below the previous low, each high below the previous high. This is considered a sell signal.
- Uptrend
Chart patterns
When analyzing price charts, technical analysts identify recurring chart formations. These patterns are commonly classified into two categories:: reversal and continuation patterns.
The most important patterns are:
- Flags, wedges, and pennants are consolidation phases that occur after steep price movements against the trend. In flags, the boundary lines run parallel during the consolidation phase; in a wedge, they converge; and in a pennant, they converge at a point. When the boundary lines are broken, it's time to act. This is considered a buy or sell signal.
- A head and shoulders pattern is preceded by a price surge, while an inverted head and shoulders pattern is preceded by a price decline. The head extends beyond the two shoulders. The neckline remains valid for at least three months and must not be breached during this time. A break below the neckline is the signal to act and is considered a buy or sell signal.
- An M-pattern forms after a prolonged price increase, and a W-pattern after a prolonged price decline. Every M or W formation includes a horizontal baseline. A break above this baseline after the second peak is the action signal and is interpreted as a buy or sell signal.